Mapping sites of environmental contamination with a dual-geometry electromagnetic (EM) system
Richard S. Taylor, Dualem Inc.
Introduction
With the publication of conductivity soundings near a landfill at Canada Forces Base (CFB) Borden, McNeill (1980) introduced the use of EM to map sites of environmental contamination. Over 150 cases published since then (Taylor, 2000) attest to the popularity that has been gained by this technique.
EM senses contamination that is present as conductive pore fluid. Common contaminants are leachate from municipal waste, and wastes from agriculture, chemical manufacturing, mining and metallurgy, and petroleum production.
Taylor (1999) described a dual-geometry EM system that geometrically sounds conductivity simultaneously to two distinct depths. The simultaneous soundings provide information about geological layering and the depth to contaminated material.
Many sites contain shallowly buried metallic containers. The distribution of metal helps to define undocumented sites, and such containers may require special treatment during site remediation. With simultaneous measurement of two distinct responses to metallic objects, the dual-geometry system enhances the capability of EM for this aspect of environmental site mapping.
Dual-geometry EM
The dual-geometry EM system incorporates a transmitter coil with horizontal windings, a horizontal receiver coil and a vertical receiver coil. As shown in figure 1, the coils form both the horizontal co-planar geometry (HCP) and the perpendicular geometry (PRP).

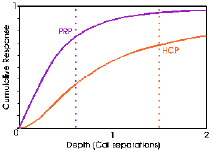
For geometric sounding, the dual-geometry system is designed to operate at low induction number, so the depth of sounding is a function of the separation between the transmitter and each receiver. Figure 2 shows the cumulative response with depth for HCP and PRP. Based on these curves, it is generally accepted that the HCP depth of sounding is 1.5 coil-separations, and the PRP depth of sounding is 0.6 coil-separations. Data in the examples that follow were acquired with the DUALEM-4 (D-4), the dual-geometry EM instrument with 4-m coil separation.
Metallic objects yield responses that are complex, but typically detectable if the dimensions of the object are at least a significant fraction of the coil separation, and if the object is within 1 coil-separation of the EM instrument.
HCP and PRP responses for such objects contrast in amplitude and symmetry. In combination, the responses enable a more accurate interpretation of the type and location of an object.
Delineation of Groundwater Contamination
The landfill at CFB Borden received ash, wood, debris and some food waste between 1940 and 1976. The landfill sits on about 20 m of sandy soil, which decreases in thickness to about 10 m at the northern edge of the area shown in figure 3. An aquiclude of clay underlies the sandy soil.
Contours of chloride concentration in test wells, from Sweeney (1983), indicate the extent of groundwater contamination. The plume manifests itself in induction logs as a horizon with conductivity between 20- and 45-mS/m. The depth to the horizon is 6.5 m in (borehole) BH 1.
The data of figure 4 were recorded at 1-s intervals on a traverse of the plume. The D-4 was carried at hip height, and at a speed of about 1.1 m/s along the gravel road north of the landfill.


As dry, sandy soil extends more than 3 m below the surface, PRP values are low, except for modest increases when the traverse crosses the core of the plume (at 105 s), and a stream (at 410 s). The deeper-sounding HCP maps the location and character of the plume; conductivities increase up to 10 mS/m over the core of the contamination.
Detection of Buried Metal
The 200-L (55-gallon) steel drum is encountered frequently during the course of environmental investigations. A drum of this type served as the target for a series of test measurements of HCP and PRP response.


The measurements were made in electrically resistive surroundings. The drum was moved past the D-4 along profiles 10 m in length, with measurements taken at 0.25-m intervals. The distance from the D-4 to the profiles ranged from 0.5 m to 4 m, in 0.25-m increments.
Figure 5 presents the PRP and HCP amplitudes for each of the profiles. The amplitudes are plotted against the distance between the D-4 and the profiles, on which the top of the drum was positioned. With increasing distance, the profile amplitudes decrease rapidly, as extrema attenuate and broaden.
The logarithms of the amplitudes show excellent correlation with the distance between the D-4 and the drum. The correlation is linear within the ranges of distance where the profiles have similar shape and character. The linear relationships suggest the use of simple guidelines, such as those of figure 5, for the interpretation of drum depth.
Buried drums at Western Michigan University (WMU) provide realistic targets for evaluating the interpretation of depth by amplitude. The targets are described (after W. Sauck, personal communication) in table 1.
| Target Description | Depth to Top (m) |
| Drum, long axis aligned with survey line | 0.5 |
| Drum, long axis upright | 0.5 |
| Drum, long axis transverse to survey line | 0.5 |
| Drum, long axis transverse to survey line | 1.0 |
| Drum, long axis transverse to survey line | 2.0 |
| 3 crushed drums, random orientation | 3.0 |
Table 1: Description of WMU drums.
Two passes at walking speed were made over the targets. For the first pass the D-4 was carried at hip height, so the distance between the instrument and each target was about 0.9 m greater than the nominal depth of burial. For the second pass, the D-4 was carried at upper shin height, which made the distance between the instrument and each target about 0.4 m greater than the nominal depth of burial.
Figure 6 shows the measured PRP and HCP amplitudes plotted against the apparent distances between the targets and the D-4. The measured amplitudes cluster around the guidelines for interpreting depth. The guidelines are broader for distances where the sampling density at walking speed can result in underestimation of amplitude.
The adherence of the measured amplitudes to the guidelines indicate that a geophysicist can use D-4 data to interpret the depth to the top of a drum, buried at depths to 3 m, to an accuracy better than 0.3 m.
Summary
Since 1980, EM has been used to map hundreds of sites of environmental contamination. EM maps contamination that is present as conductive pore fluid, or that is associated with shallowly buried metallic containers.
At many sites, geological layering controls the location and migration of contamination. Geometric EM soundings yield simple and reliable information about conductivity and depth. Dual-geometry EM is especially useful, as it sounds conductivity simultaneously to two distinct depths.
Dual-geometry EM produces two profiles over metallic containers that are distinct in amplitude and symmetry, improving the depth of detection and the interpretability of the responses from these significant targets.
References
McNeill, J.D., 1980, Electromagnetic terrain conductivity measurement at low induction numbers: Geonics Ltd., Technical Note TN-6.
Sweeney, S.J., 1983, Concentration, distribution and time variations of a contaminant plume in an unconfined sand aquifer: B.Sc. Thesis, University of Waterloo.
Taylor, R.S., 1999, Development and applications of geometric-sounding electromagnetic (G-SEM) systems: Society of Exploration Geophysicists 1999 Technical Program Expanded Abstracts, Sixty-Ninth Annual Meeting.
Taylor, R.S., 2000, An annotated bibliography of applications of geo-conductivity meters: www.dualem.com/abib.html.
Acknowledgements
The author expresses his thanks to the staff of CFB Borden and the Environmental Geophysics Facility at the University of Waterloo for information about and access to the CFB Borden Test Site, to the staff and students of the WMU Institute for Water Sciences for assistance with data acquisition at the Asylum Lake Property, and to Dr. Scott Holladay of Geosensors Inc. for helpful suggestions regarding data calibration.
(Updated: 2001-12) Download PDF
Dualem Products
DUALEM products are used by companies and universities on every continent. Our products fulfill a variety of use-cases in industry and academia.