DUALEM-4 measurements near a large oil-pipeline
On May 8, 2014, measurements were made with a DUALEM-421 electromagnetic (EM) surveying instrument adjacent to and over a 762-mm (30 inch) oil pipeline near Toronto, Canada. The DUALEM-421 incorporates six EM arrays operating at 9 kHz; three arrays have horizontal coplanar (HCP) geometry, with lengths of 4-, 2- and 1-m; three arrays have perpendicular (PRP) geometry, with lengths of 4.1-, 2.1- and 1.1-m. This note shows measurements primarily of the HCP and PRP arrays with nominal 4-m length, from nine traverses across the marked route of the pipeline. The measurements were made with the arrays inline with the traverse direction (i.e. approximately perpendicular to the pipe).
Measurements were made with the instrument mounted on a sled for all traverses; array height above the ground for such measurements was about 0.2 m. For one traverse, measurements were repeated with the arrays held at 2.2-m height. The DUALEM-421 has an internal WAASdifferential GPS that positioned the measurements. The rate for positioning and for acquisition of the data presented herein was 1 Hz.
The pipeline route trends northeast-southwest through the survey site; thus, the traverses were oriented northwest-southeast. The site is bounded on the northwest by wild vegetation and on the southeast by conductive infrastructure. The terrain generally has a gentle slope from northwest to southeast. There is an excavation to the northeast of the site, under which the pipe remains buried. Evidently, this requires the burial depth of the pipe in the northeastern end of the site to increase well beyond the nominal 1-m minimum. Wild but low vegetation covers the site, which gave little hindrance to surveying. The ground was locally saturated on the survey day.
DUALEM instruments resolve two components of response, inphase (I) and quadrature (Q), for each array. I is the component of the induced (secondary) magnetic field that is inphase with the (primary) field of the transmitter, expressed in parts-per-thousand (ppt) of the strength of the transmitted field at the array-receiver. Q is the component 90o out-of-phase with the transmitted field; its amplitude in ppt is automatically scaled by the DUALEM-421 into low-inductionnumber apparent-electrical-conductivity, but this note describes an example of high induction in a metal pipe. Accordingly, Q values presented herein have been converted back to ppt for comparability with I values. PRP-I responses were relatively high in amplitude-range but were noisy and had significant zero-offset. For clarity and conciseness, PRP-I is shown in only in a few figures of this note, but amplitudes are summarized in the discussion.
The spacing between the nine traverses was roughly equal, and averaged about 15 m. From southwest to northeast, the traverses are named 1 NE, 2 NE, and so on to 9 NE.
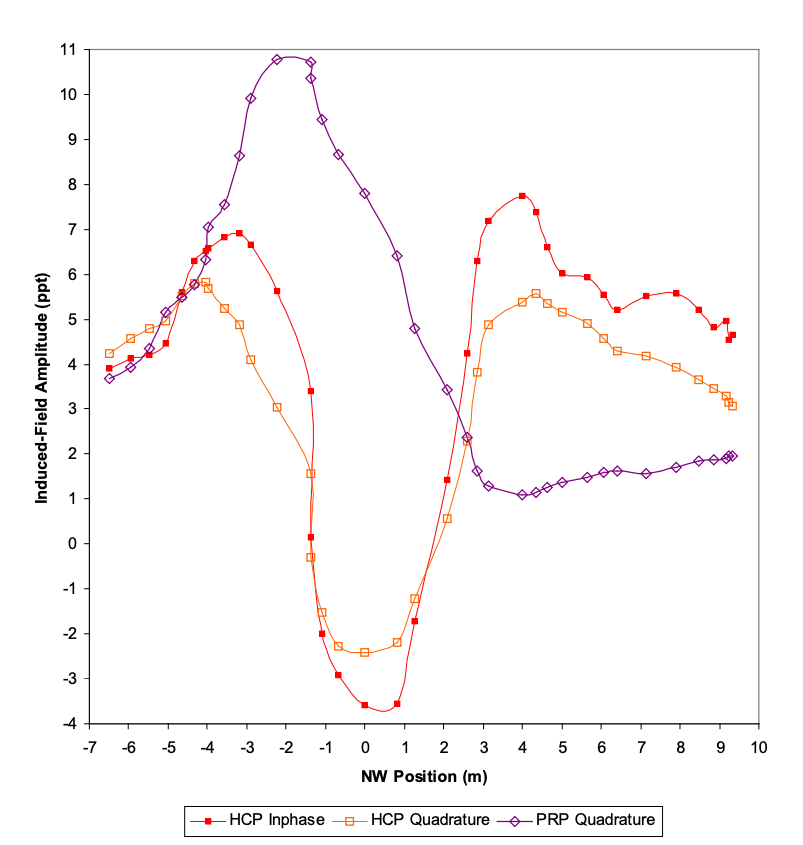
Both HCP components exhibit the shoulders-and-trough (ST) pattern and PRP-Q shows the crossover (CO) pattern. These patterns are typical for inline HCP- and PRP-arrays traversing a conductor for which the width and depth are less than the array length. Interpretational tools exist for quantitative estimation of depth.1 Qualitatively, greater range of amplitude and lesser breadth of the patterns indicate shallower burial of the pipe. Pattern clarity suggests shallower burial as well, but it is also affected by surveying factors such as positioning accuracy, along with unknown characteristics of the ground and objects that it might contain.
There is no apparent response from the conductive infrastructure beyond the southeastern end of the traverse.
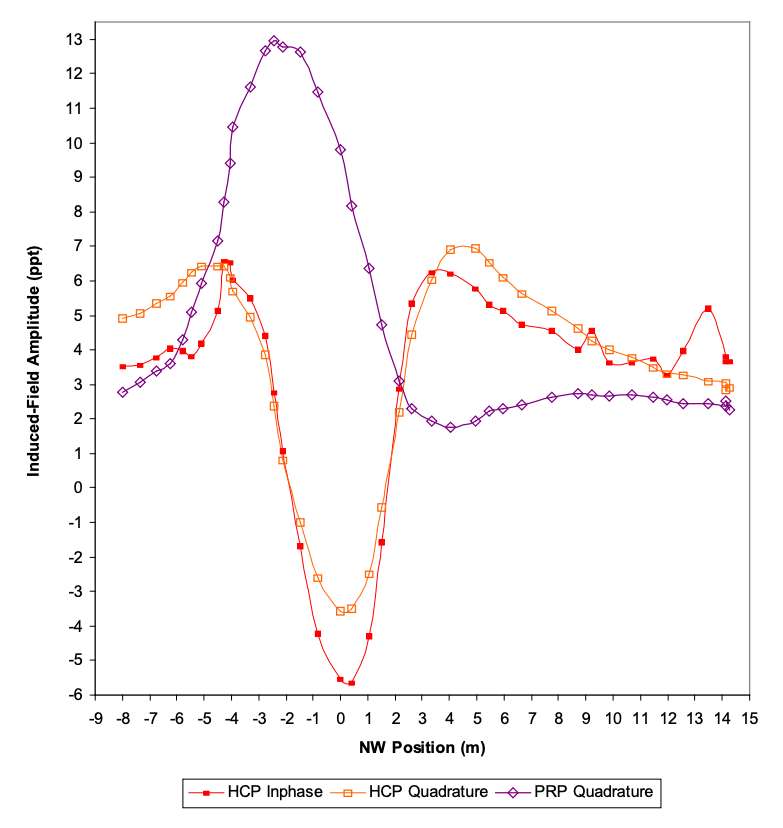
Figure 2 for traverse 2 NE shows again the typical HCP ST and PRP CO patterns. Amplitude ranges are a little greater than at traverse 1 NE, suggesting the pipe is a little shallower beneath this traverse.
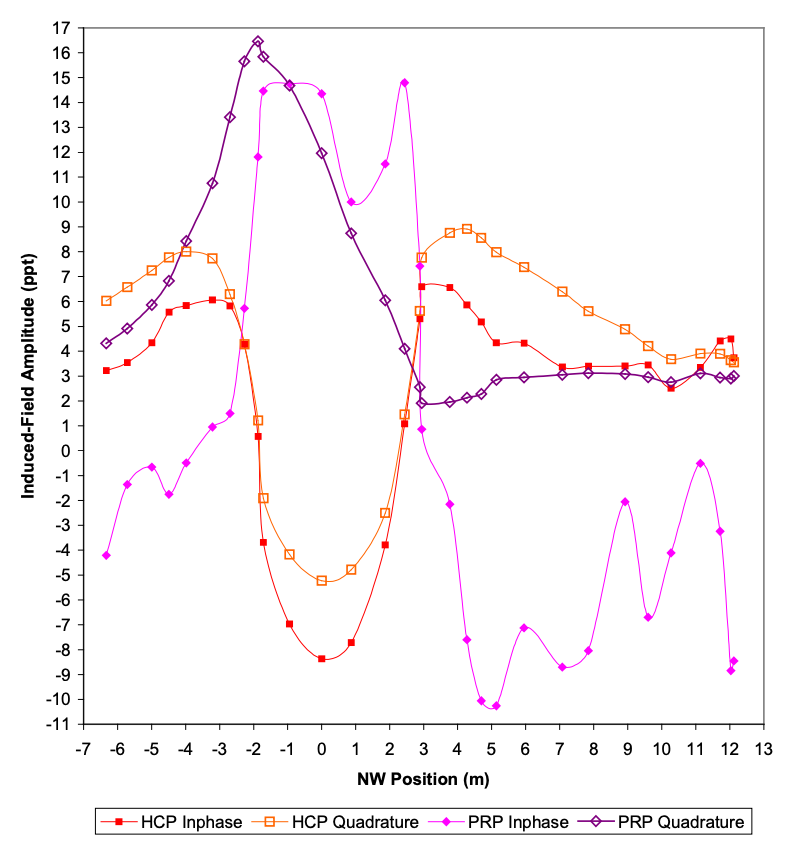
Compared to the previous figures, figure 3 for traverse 3 NE shows that amplitude ranges have increased again, along with the clarity of the HCP ST and PRP-Q CO patterns. Thus, the pipe appears to be at its shallowest yet. The figure also shows PRP-I, with its characteristic high signal, high noise and shifted zero-level; the zero level appears to be around -10 ppt.
Due to high amplitudes, a second pass was done on the traverse 3 NE while holding the DUALEM-421 overhead, so that depth to the pipe below the sensor was increased by about 2 m.
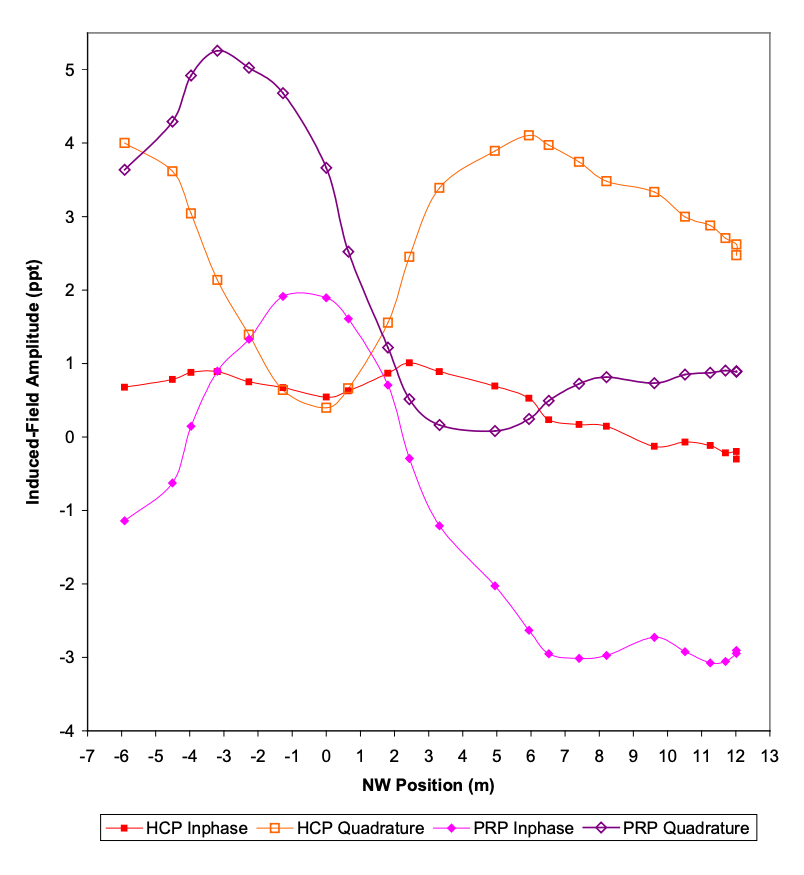
Figure 3a shows the 3 NE measurements at 2.2-m height. The range of the HCP-I ST pattern is attenuated to about 0.5 ppt, with diminished shoulders and a vestigial trough. The ranges of the PRP-I and both Q patterns are less reduced, and PRP-I measurements show much less noise. The PRP-I zero-level, about 50 minutes after the on-ground traverse, is around -3 ppt. The Q patterns are broadened, leaving them significantly incomplete at the southeastern end of the traverse. Several more metres of measurements are needed to define the southeastern shoulder of the HCP-Q pattern, and to find a southeastern base level of the PRP-Q pattern.
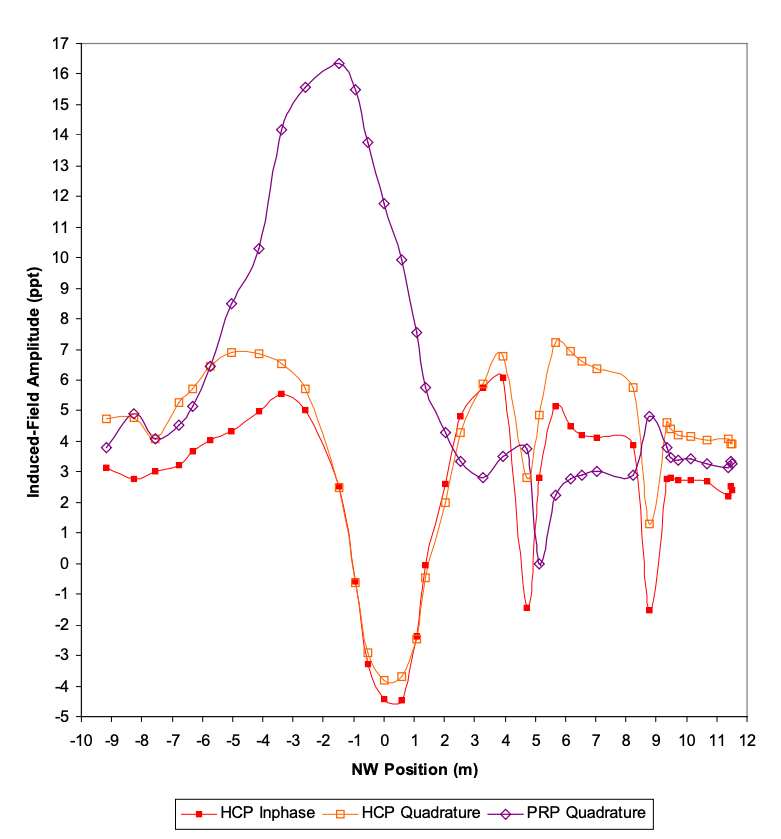
Figure 4, for traverse 4 NE, shows amplitude ranges slightly smaller than those of traverse 3 NE (in figure 3). Thus, the burial depth of the pipe might have reached a minimum between traverses 3 NE and 4 NE.
The figure also shows smaller ST and CO patterns from unknown sources around positions 5 NW and 9 NW, and perhaps the edge of a pattern at the southeastern end of the traverse.
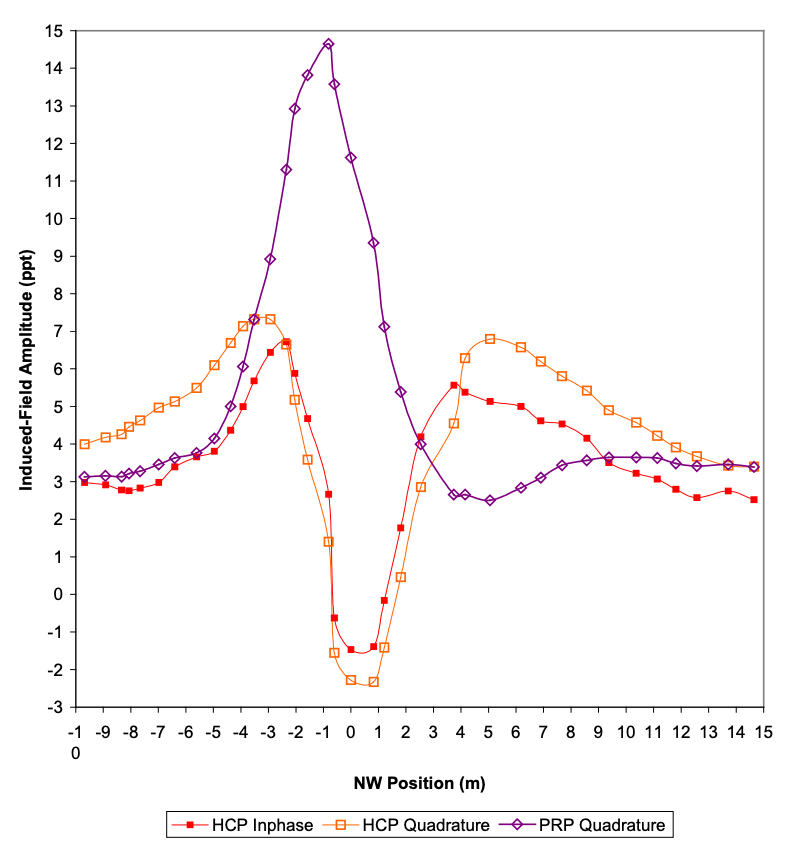
Figure 5, for traverse 5 NE, shows another small decrease in amplitude ranges compared to those of traverse 4 NE which suggests that burial depth has increased again, having reached a minimum between traverses 3 NE and 4 NE.
5 NE was the longest profile, and Q values near its ends indicate that the conductivity of the ground away from the pipe is around 10 mS/m.
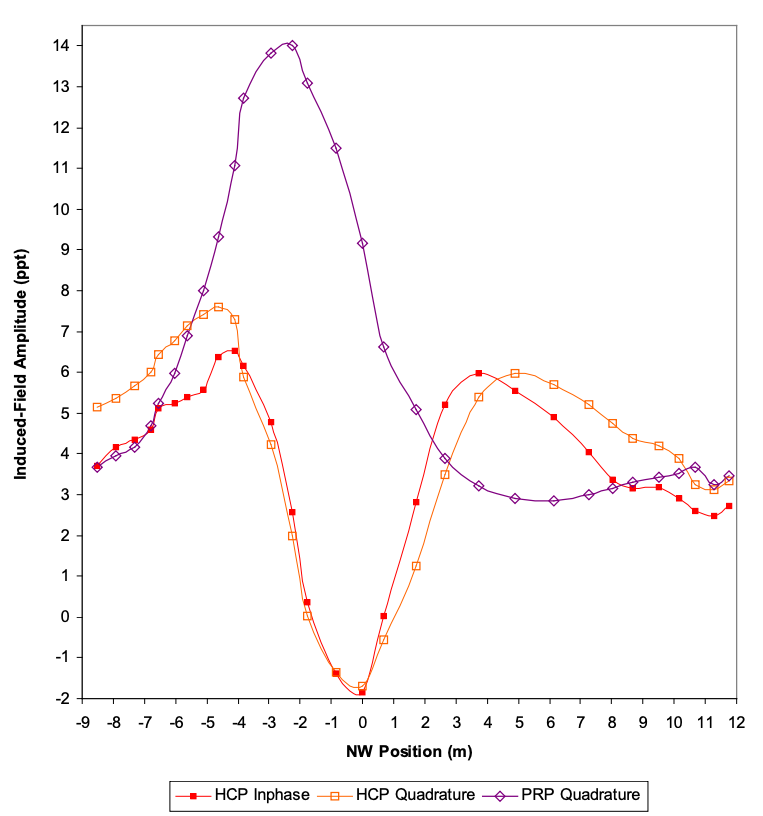
Figure 6, for traverse 6 NE, shows further small decreases in amplitude ranges compared to those of traverse 5 NE.
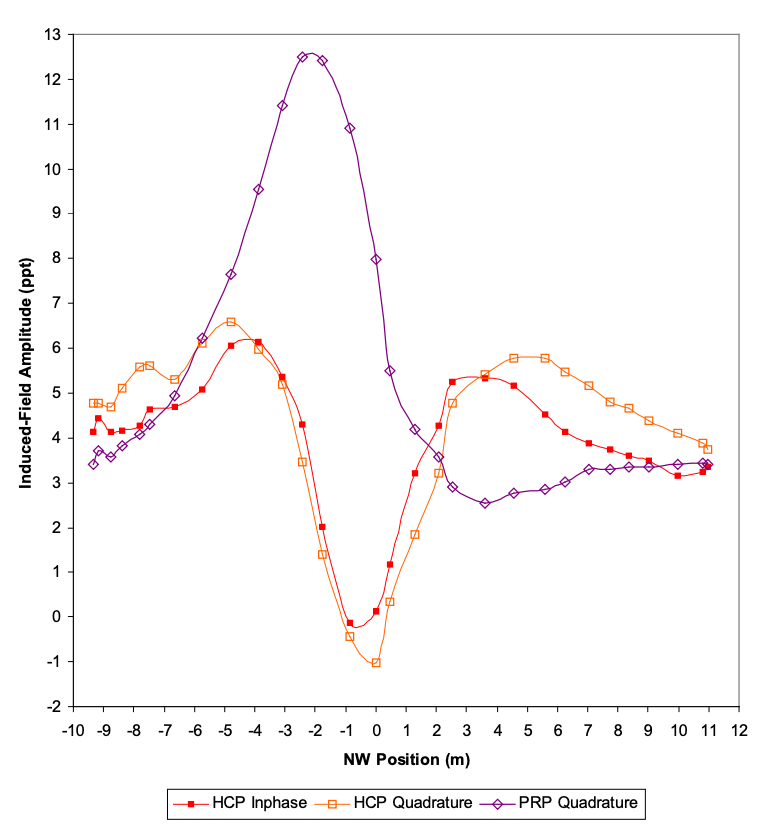
Figure 7, for traverse 7 NE, shows further small decreases in amplitude ranges from those of traverse 6 NE. The ranges are now comparable to those of traverse 1 NE, suggesting that the pipe is again as deep as it was at the southwestern edge of the survey area.
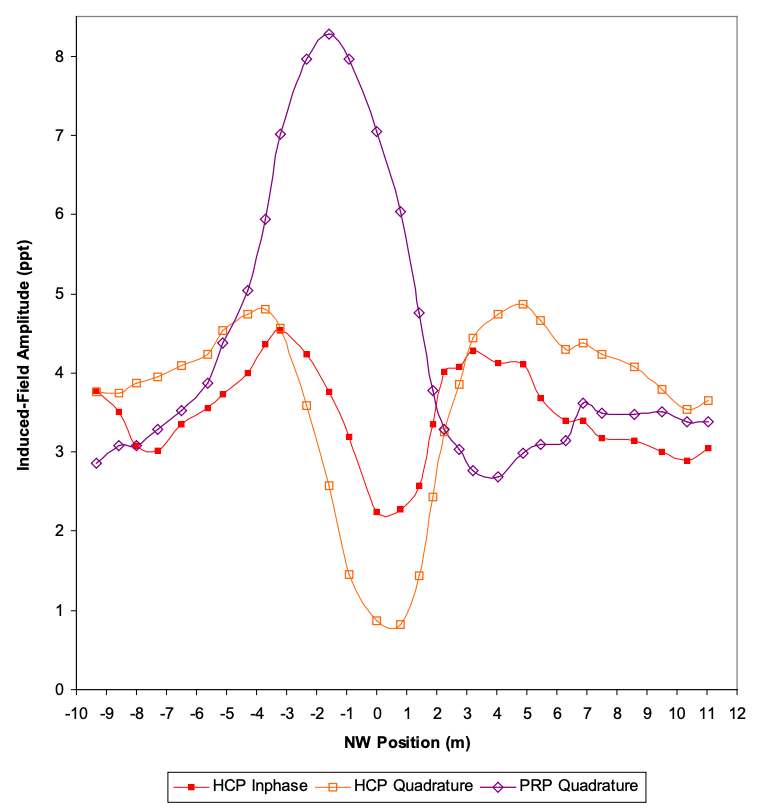
Figure 8, for traverse 8 NE, shows significant decreases in amplitude ranges from those of traverse 8 NE, suggesting that the burial depth of the pipe has increased substantially.
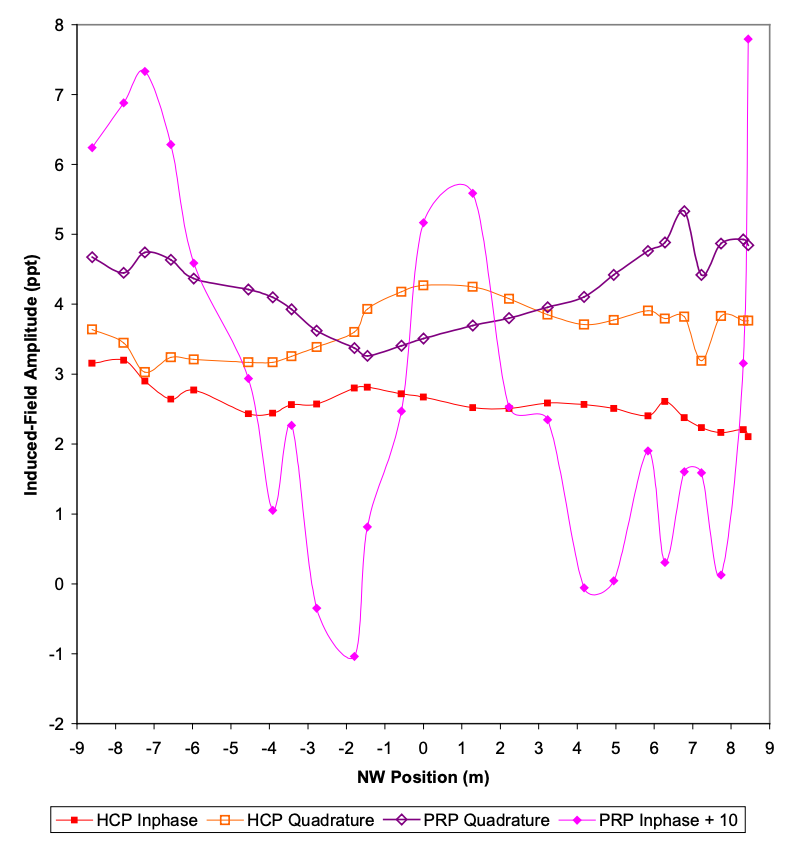
Figure 9 shows the measurements for the most northeasterly traverse, 9 NE. For plotting convenience, 10 ppt have been added to each PRP-I value. (These measurements were made about 25 minutes before the on-ground measurements of traverse 3 NE). HCP and PRP-Q amplitude ranges have decreased below those measured at 2.2-m height over traverse 3 NE, suggesting the burial depth of the pipe exceeds 3 m. The range of PRP-I measurements exceeds the 5 ppt seen at height over 3 NE, but variations such as those seen at surface on 3 NE make the source of the responses uncertain. At depth of 4-m or more a large pipe should provide broad but weak positive responses for both the HCP and PRP arrays, such as the rises in HCP-Q and PRP-I
around the middle of the marked route of the pipeline (position 0) but there is little to distinguish these responses from noise.
Discussion
The observed range of amplitude depends slightly on measurement interval, and quantification is subject to some interpretation of source and identification of noise. The following table contains range estimates in ppt.
| Traverse | HCP-I | HCP-Q | PRP-I | PRP-Q |
| 1 NE | 11 | 8.2 | 21 | 9.7 |
| 2 NE | 12 | 11 | 22 | 11 |
| 3 NE | 11 | 14 | 25 | 15 |
| 3 NE (a) | 0.46 | 3.7 | 4.9 | 5.2 |
| 4 NE | 11 | 11 | 23 | 14 |
| 5 NE | 8.2 | 9.6 | 19 | 12 |
| 6 NE | 8.4 | 9.3 | 19 | 11 |
| 7 NE | 6.3 | 7.6 | 20 | 10 |
| 8 NE | 2.3 | 4 | 9.1 | 5.6 |
| 9 NE | 0 | 1.1 | 6.6 | 0 |
The PRP-I range was consistently the greatest, so this component of response seems to have the potential for detecting a pipe to greatest depth. In addition, the typical PRP response-patterns are more stable with changes in depth than are HCP patterns, shifting from a crossover with a large positive peak to one side of a shallow pipe and a small trough on the other to a fairly symmetrical peak centered over a deep pipe. However, noise in the on-ground PRP-I responses makes these ranges the least reliable. Noise was significantly reduced where measurements were repeated over 3 NE at 2.2-m height. The sensitivity of PRP-I to magnetic susceptibility is complex, but decreases rapidly with height. A traverse repeated at a range of heights from on-ground to overhead might reveal a height at which PRP-I measurements become similar in interpretability to HCP and PRP-Q measurements.
HCP-I, HCP-Q and PRP-Q were close in amplitude range, but the PRP-Q range seemed to show less attenuation as ranges decreased and measurement height was increased. PRP-Q is also most sensitive to surficial conductivity, so measurement at a height ideal for PRP-I should also decrease the sensitivity of PRP-Q to variation in the conductivity of cover material.
Less stability in zero-level makes the absolute accuracy of PRP-I measurements less certain, which limits their suitability for quantitative modeling of the properties of buried pipes and surrounding earth. Since the response of an inverted PRP array over uniform or layered ground is equal in amplitude but opposite in sign to an upright PRP array, it is fairly easy to quantify zero-level drift. Periodic tests of zero-level with upright and inverted measurements might be adequate to make PRP-I measurements comparable in absolute accuracy to PRP-Q and HCP measurements.
The DUALEM-421 provided measurements of 2-m and 1-m arrays as well. As examples, figures 10 and 11 show these measurements for traverse 3 NE at 0.2-m height.
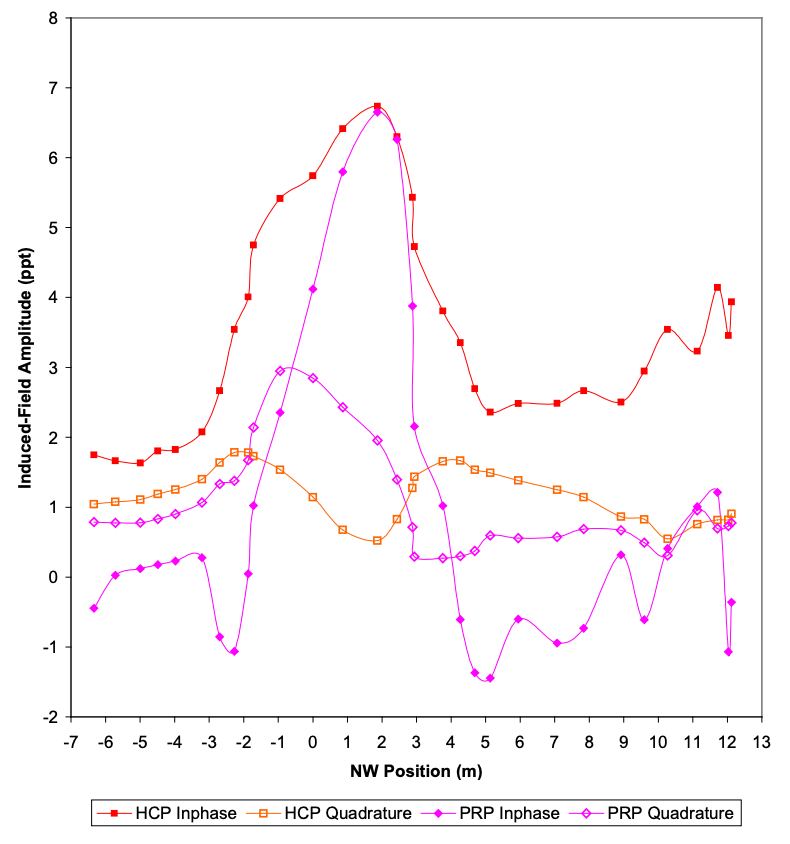
The combined width and depth of the pipe below traverse 3 NE is likely around 2-m, similar to the array length for the measurements shown in figure 10. The high-induction response of the pipe provides most of the response, with I greater than Q in amplitude. The I patterns also suggest a broader source with central peaks, compared to the HCP-Q ST response and the PRP-Q CO response. (The 2-m patterns are shifted about 1-m NW relative to the 4-m patterns, due to the 1-m offset between the 2-m and 4-m array centres in the DUALEM-421).
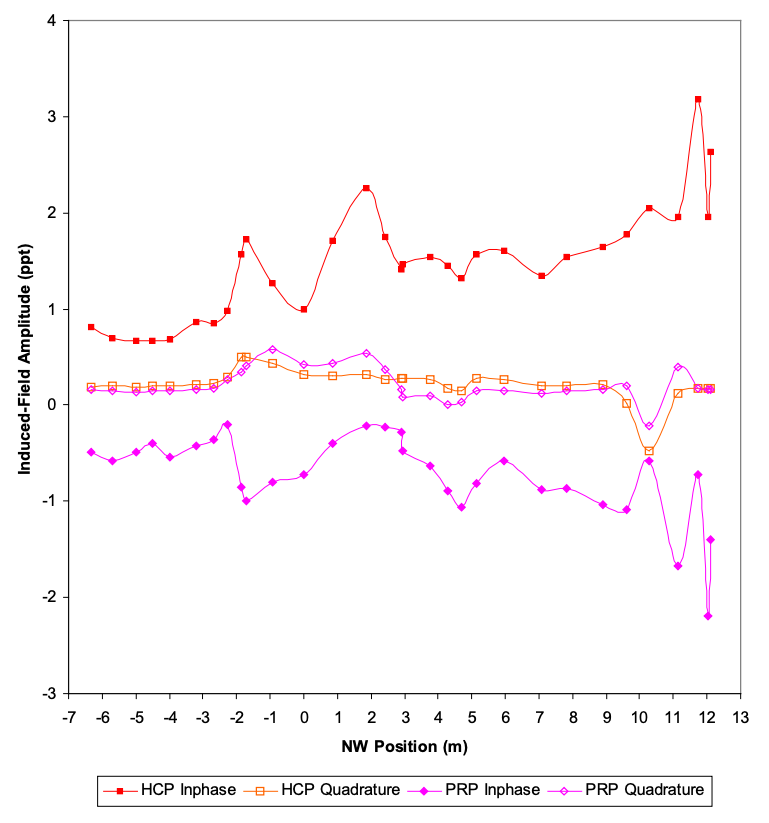
Due to array-centre positions in the DUALEM-421, the pipe responses in the 1-m measurements of figure 11 should be centered around 1.5 m NW. However, 1-m I responses are relatively small in amplitude due to the burial depth, and effectively indistinguishable from noise. Q amplitudes fluctuate somewhat within a few metres of the pipe location, compared to background ECa values of about 8 mS/m for PRP and 11 mS/m for HCP to the southeast and northwest.
Conclusions
The measurements presented herein demonstrate that the 4-m arrays of DUALEM instruments can locate a large steel-pipe buried at typical depth, and suggests that the arrays can continue to detect the pipe at burial depths in excess of 3 m.
Both I and Q measurements locate the pipe, and the amplitude range and breadth of characteristic responses might be adequate to indicate relative changes in burial depth where overlying fill is reasonably consistent in conductivity. If so, burial depth of the pipe seems to decrease slightly from the southwestern edge of the survey area to a minimum between traverses 3 NE and 4 NE, and then increase slightly to a point between traverses 7 NE and 8 NE, and then increase rapidly to the northeastern edge of the survey area.
Repeated tests at several heights might help to refine significantly the procedures for acquiring data of ideal quality. Q measurements away from the pipe indicate that the conductivity of the ground is generally around 10 mS/m. Compared to the high-induction response from the pipe, the response from the ground is small. This suggests that reference data for the estimation of pipe depth in resistive conditions could be obtained by repeating a traverse where the pipe seems to be relatively shallow (e.g. 3 NE) at several heights between on-ground and as-high-as-practical.
Current-gathering in ground around the pipe has the potential to increase the maximum depth of detection somewhat as ground-conductivity increases. Similar tests at several heights might also provide useful data for estimating the depth of pipes of different diameter in ground of different conductivity.
The I measurements of 2-m arrays showed clear responses to the large pipe buried at a likely depth of 1 m. The measurements of 1-m arrays provided no clear responses. Signal levels and response clarity should decrease for measurements are taken at greater height. Nevertheless, the measurements of the arrays should remain valuable input for the quantitative estimation of the EM properties of the earth above and adjacent to the pipe.
May 21st, 2014
1 Software is available commercially, and type curves are published in references such as in Chapter 3 (Profiling Methods Using Small Sources) of Volume 2, Electromagnetic Methods in Applied Geophysics, Misac N. Nabighian, ed. (Society of Exploration Geophysicists, Tulsa, 1988).
Dualem Products
DUALEM products are used by companies and universities on every continent. Our products fulfill a variety of use-cases in industry and academia.